More time to understand the numbers.
Upload the broker’s materials or link the data room. The terminal extracts the rent roll and normalizes the operating statement, then builds the model for the asset class. Switch between Base, Upside, and Downside. Your analysts set the assumptions.
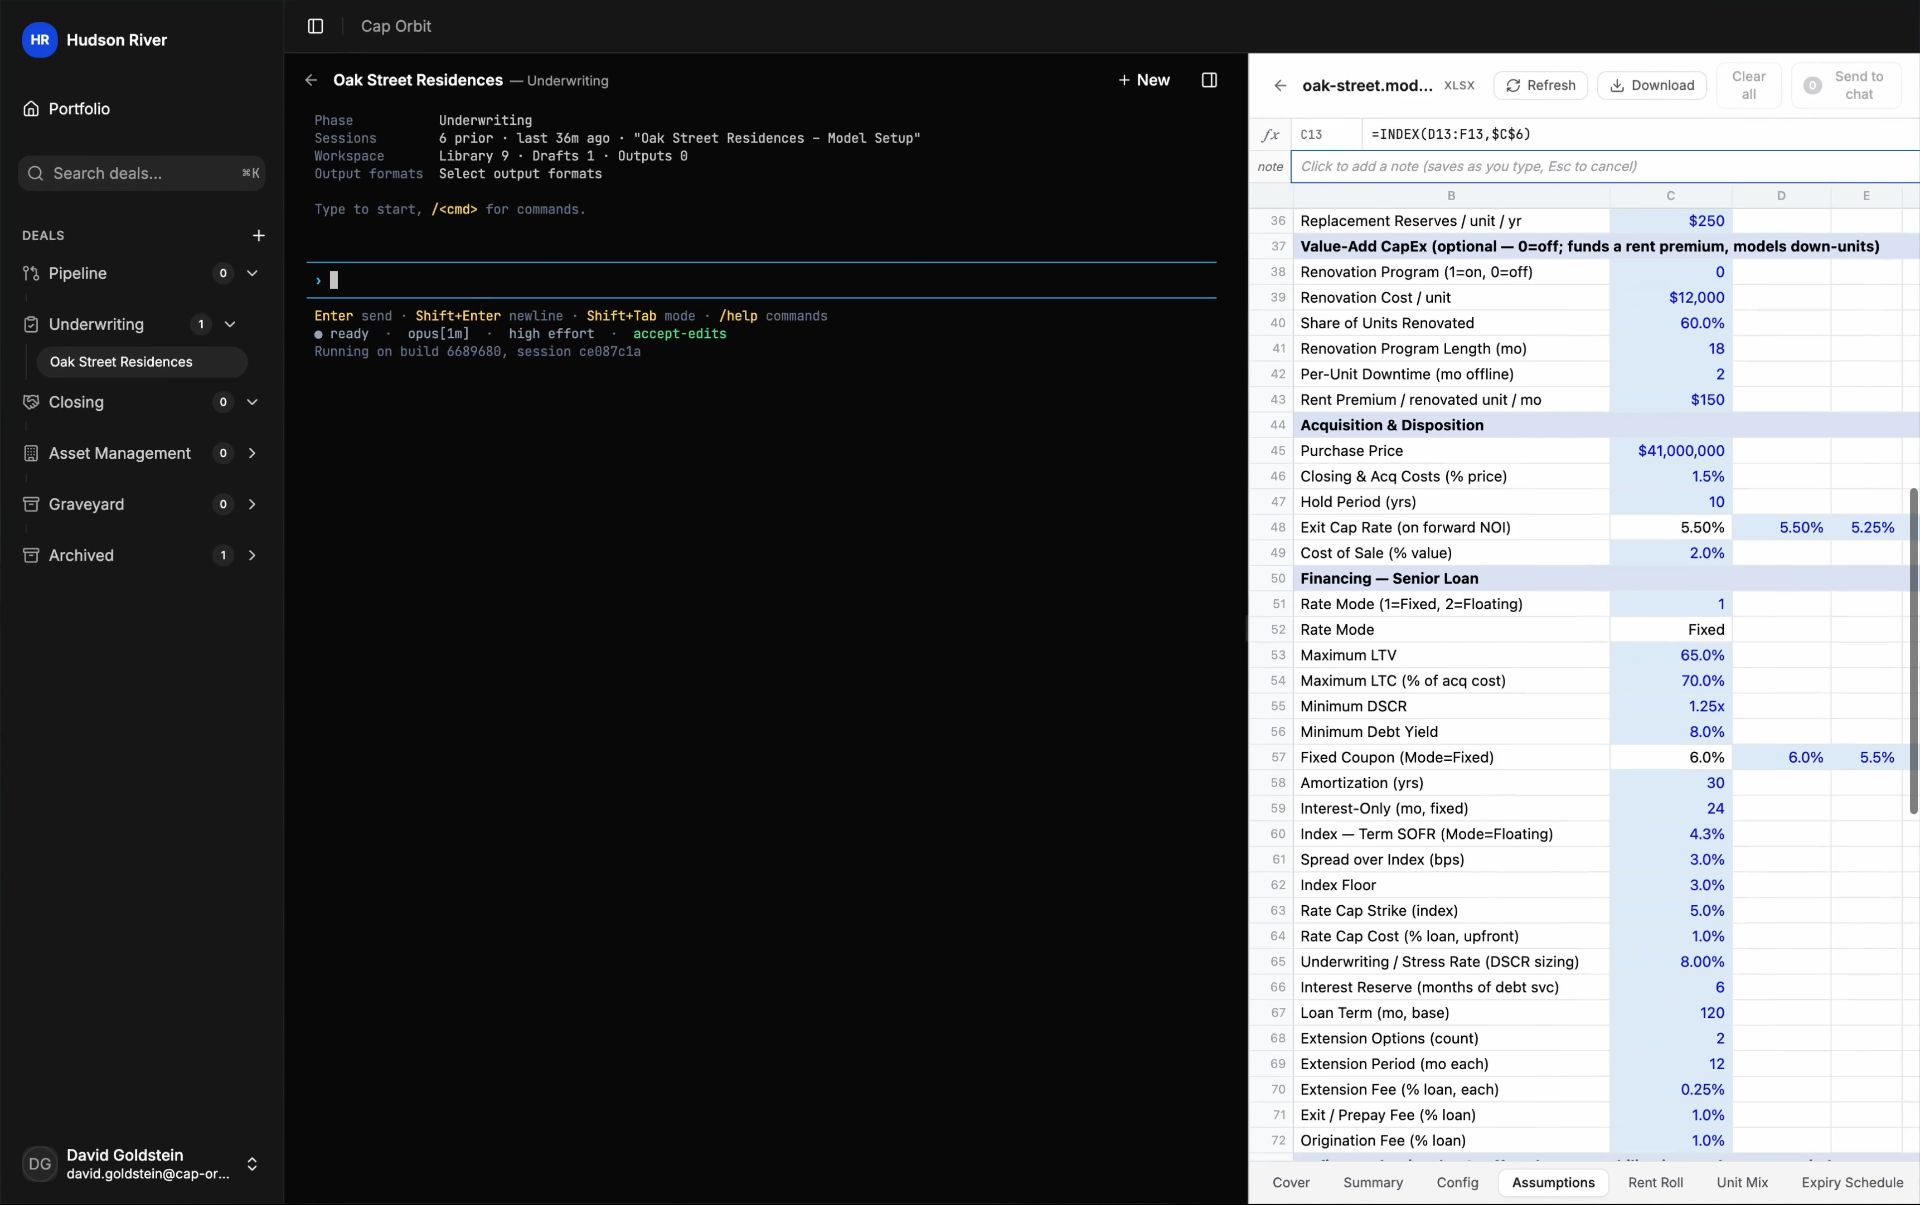
The underwriting path
From source documents to a supported view.
Start with the documents and a clear operating picture. Set your assumptions, run scenarios, and check the result against the source.
- 01
01
Read the documents
The unit-by-unit rent roll and the trailing-twelve come out of the offering materials as clean extracts.
- 02
02
Normalize the operating statement
The seller’s accounts map onto a standard expense set and the NOI bridge is built. Two deals read on the same lines.
- 03
03
Set the assumptions
Set each driver, from revenue and expenses to acquisition, capex, and financing. Review the rationale for each proposal. It enters the model only when the analyst confirms.
- 04
04
Build and run the underwrite
The terminal stands up the model for the asset class, sizes the debt to the binding constraint, and runs the three scenarios.
- 05
05
Review the underwrite
Check the underwrite against the documents. Change a cell while a colleague works in the next column. Formulas recalculate, and the terminal uses your changes on its next pass. Take the model and memo support to committee together.
01 · Reading the deal documents
A clean rent roll out of whatever the broker sent.
- Finds the unit-by-unit table wherever it sits: buried in a larger workbook, or as an exhibit deep in the offering memorandum. Scanned pages read as well as clean spreadsheets.
- Every extracted figure traces to the exact file, sheet, and row or page. The unit count and the rents foot to the totals the document states.
- See occupied units without lease expiries, expired leases, and duplicate units. Catch zero or negative rents on occupied space.
- Inferred values are marked. Occupancy, mark-to-market, and the risk call stay with the analyst.
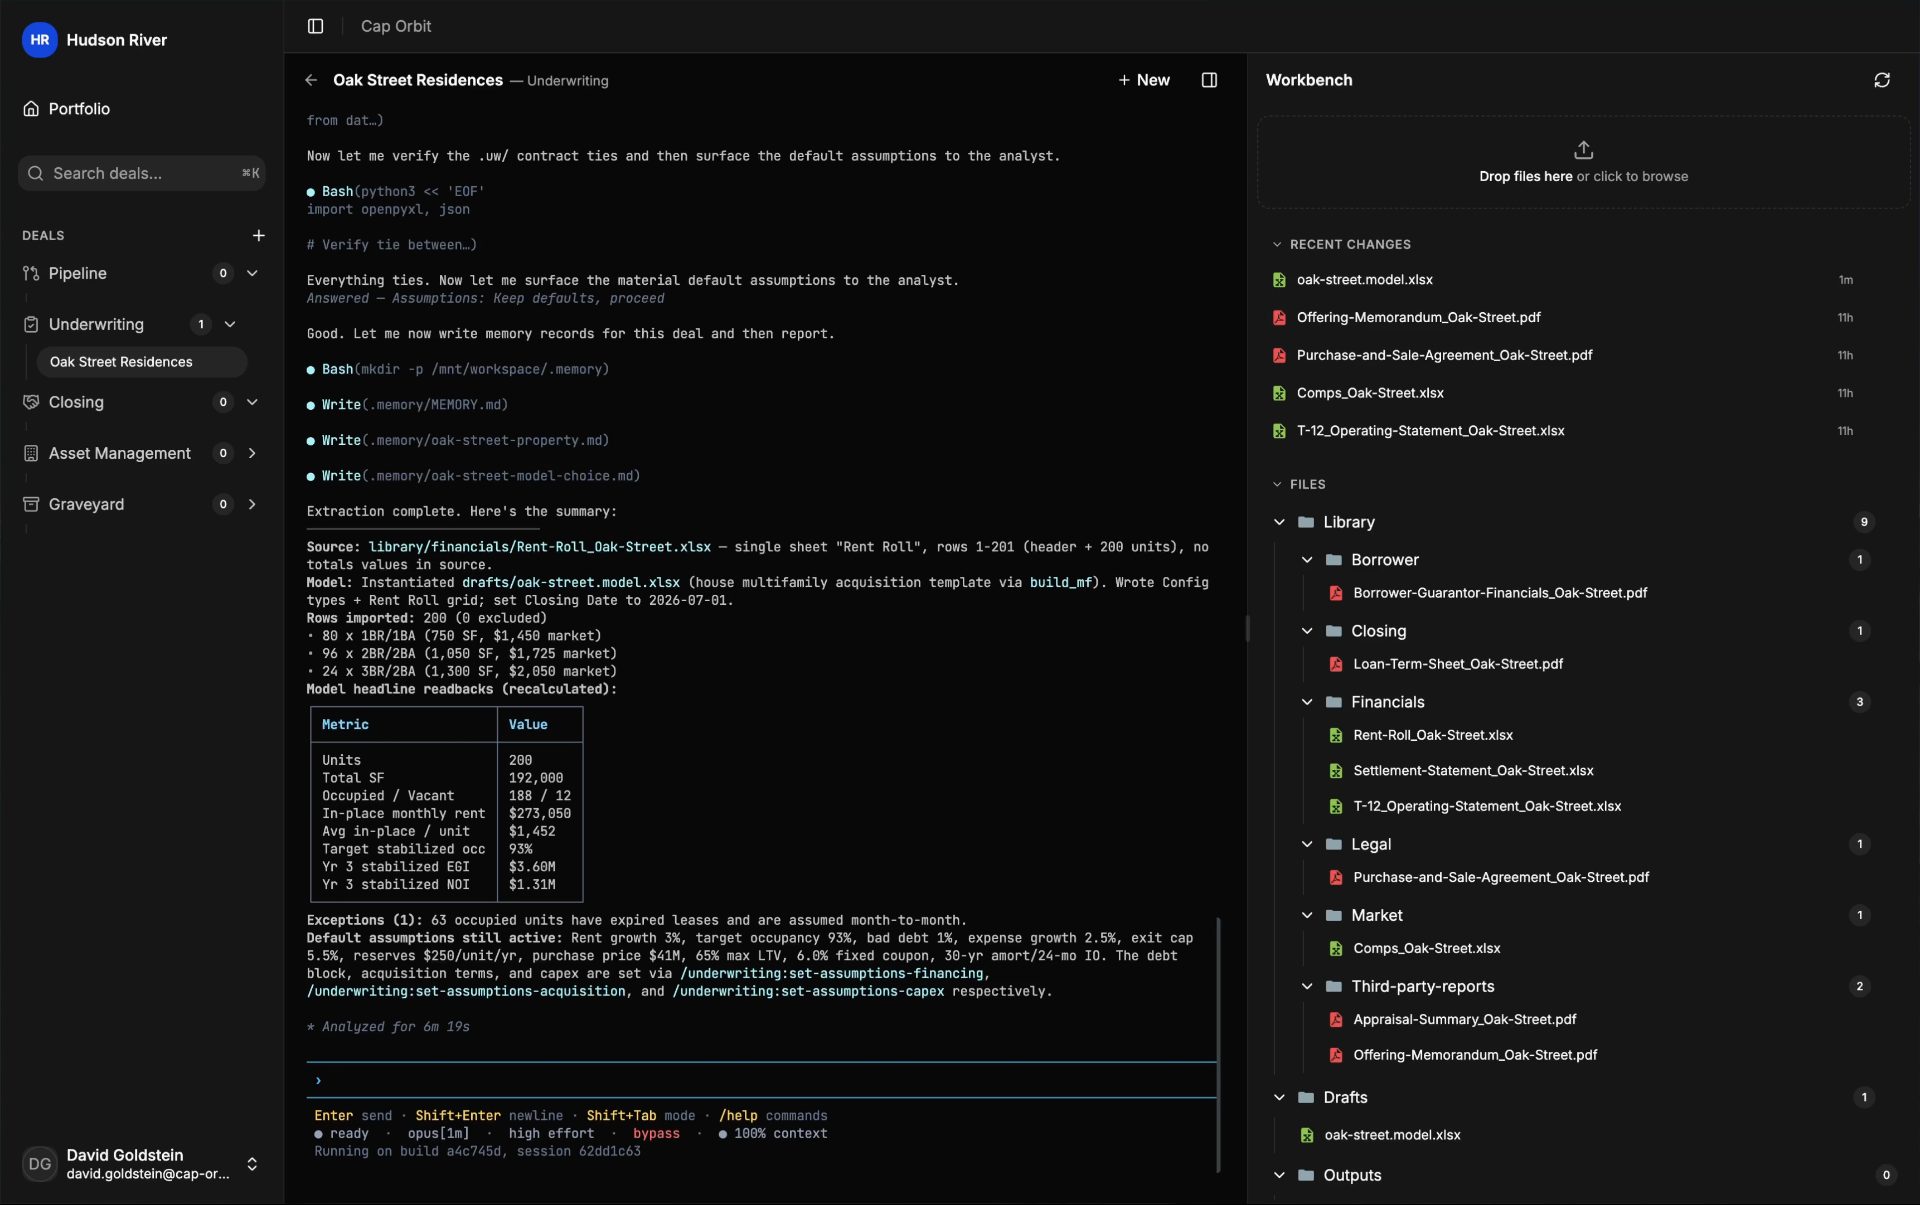
Fig · Rent roll and T-12, traced to source
Setting the assumptions
See the proposed change. Make the call.
Compare each current figure with the proposal and its rationale. Confirm it before it enters the model. Taxes reassess onto purchase price. Insurance is re-quoted and management fees move to market. Pressure-test the sponsor’s value-add plan before using it.
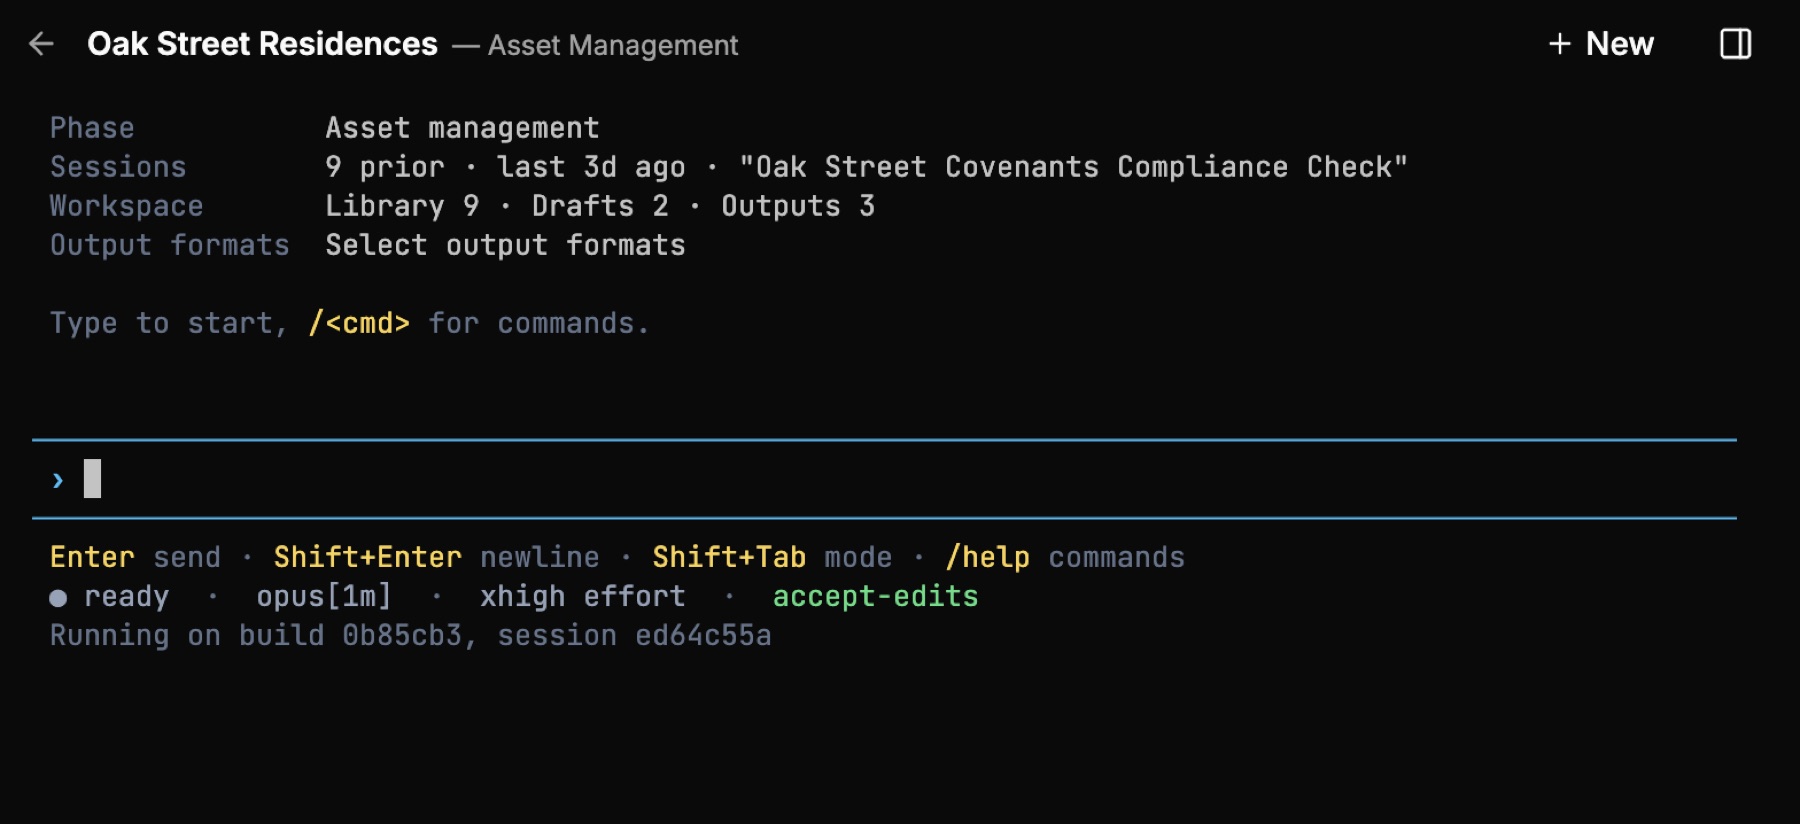
Fig · Proposed, written on accept
Building the model
An institutional model, sized to the asset class.
Multifamily, build-to-rent, student and seniors housing, office, retail, industrial, medical office, life-science, hotel, self-storage, data center, and more, each with the right entry stance for an acquisition, a ground-up development, or a merchant build. Every asset class runs its own model, sized to its own binding constraint. Pick one from the catalog of house models, searchable by sector and strategy, or attach your own. Every workbook is checked against your house formula standards and opens in Excel without repair.
Residential
Multifamily
Build-to-rent
Student
Seniors
Affordable
Manufactured
Condo
Commercial
Office
Retail
Industrial
Medical office
Hospitality
Hotel
Specialized
Data center
Life science
Self-storage
Land
Fig · The asset classes a CRE fund trades
02 · Running the scenarios
Base, Upside, and Downside, priced together.
- One switch re-prices every scenario-driven assumption. The upside and downside bands move as a set, with nothing to rebuild.
- The full stack on the equity: levered and unlevered IRR, equity multiple, going-in cap rate, yield on cost, and cash-on-cash, with year-by-year coverage across the hold. Indicative terms draft from the same numbers.
- The risk floor: breakeven occupancy, peak equity drawn, and a sensitivity grid that flexes returns against exit cap and exit NOI.
- Compare the underwritten year with trailing-twelve actuals in an NOI bridge. See dollar and percent changes on each line.
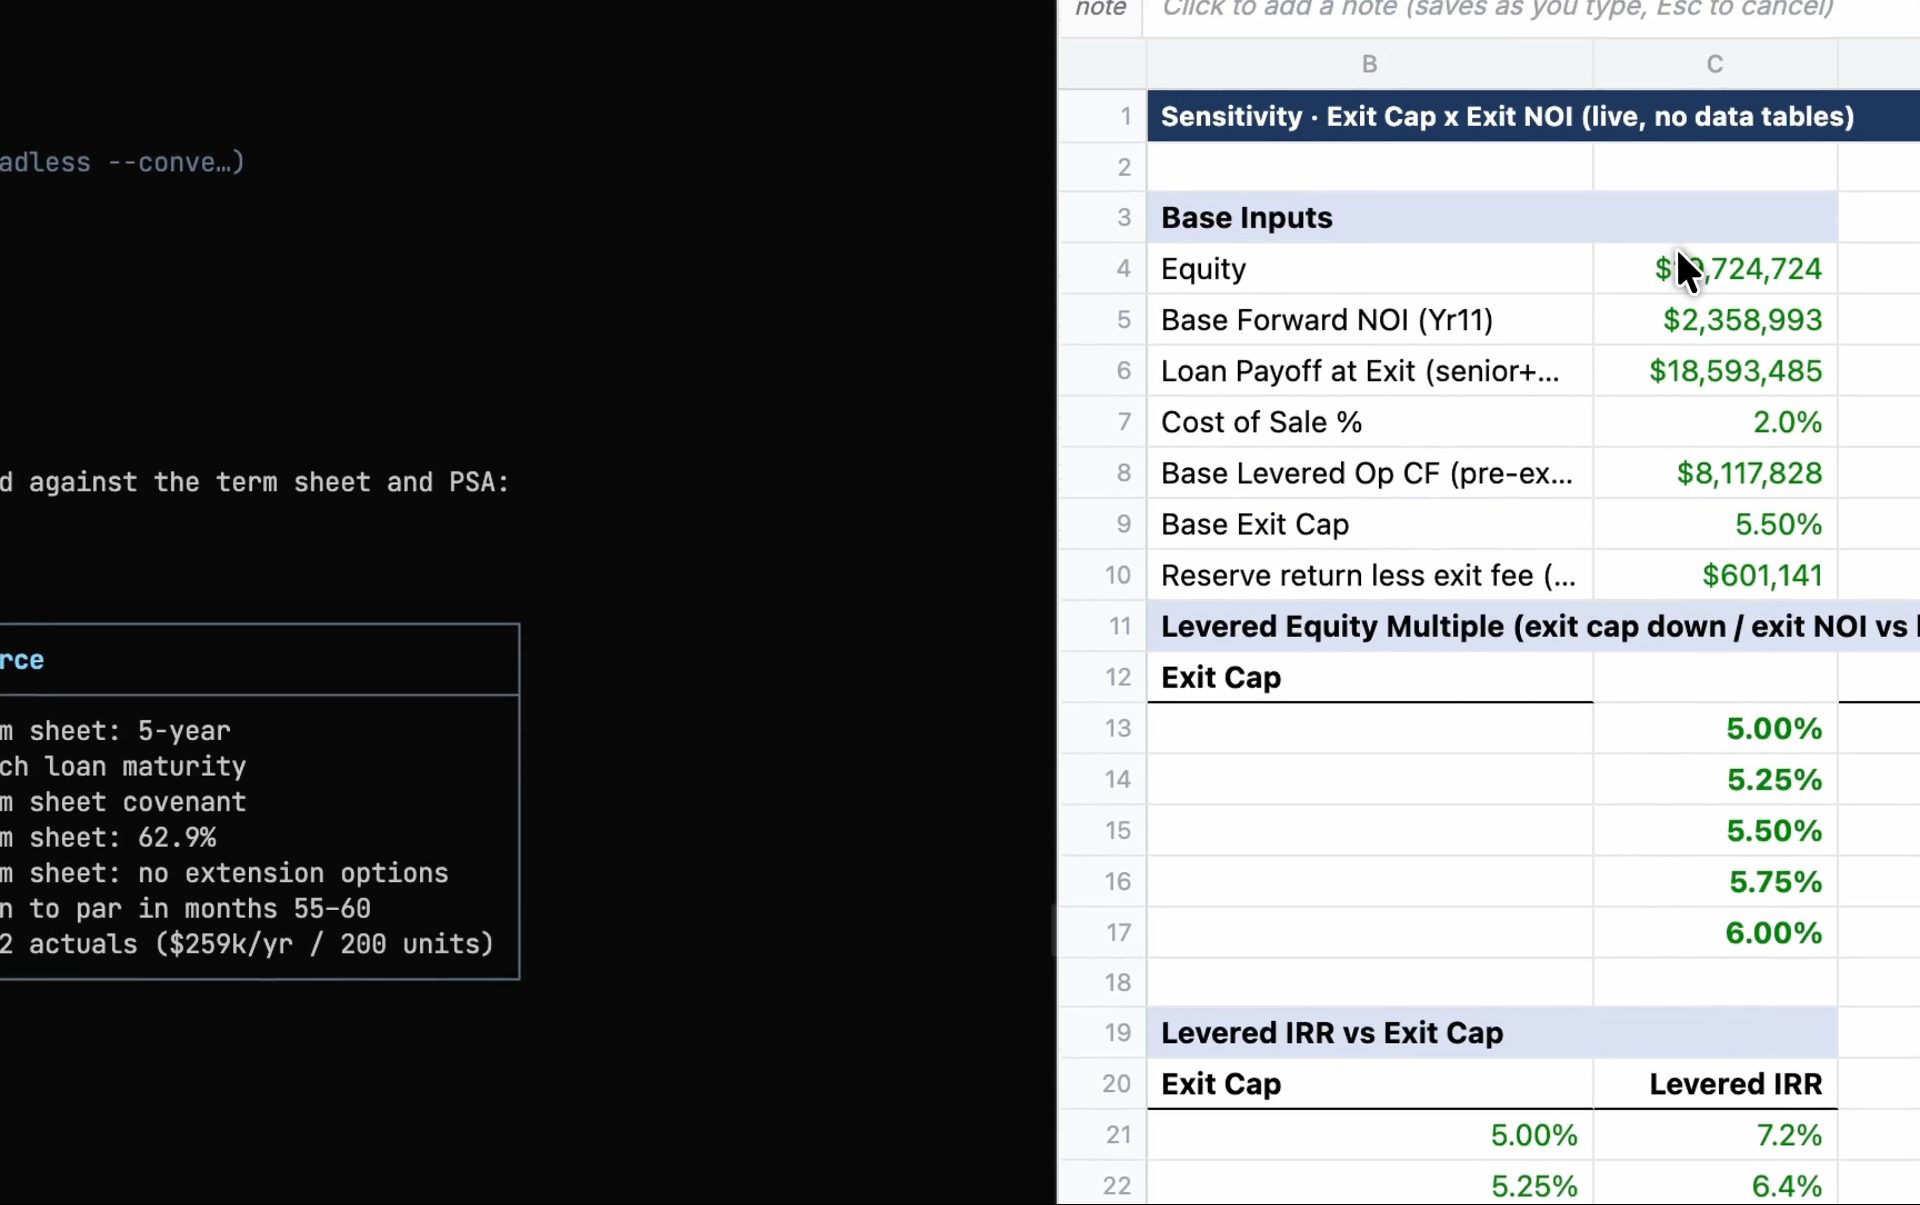
Fig · The return stack and sensitivity grid
Committee-ready numbers, sourced to the line.
The terminal builds the model. Your team edits it in place, with more time to understand the asset, weigh risk, and set a price. You own the recommendation. The work stays private to your firm, inside your environment.